Brief:
Source a scientific, cultural or environmental story that matters to you and create a piece of information design to communicate its information and reveal a new insight.
Process:
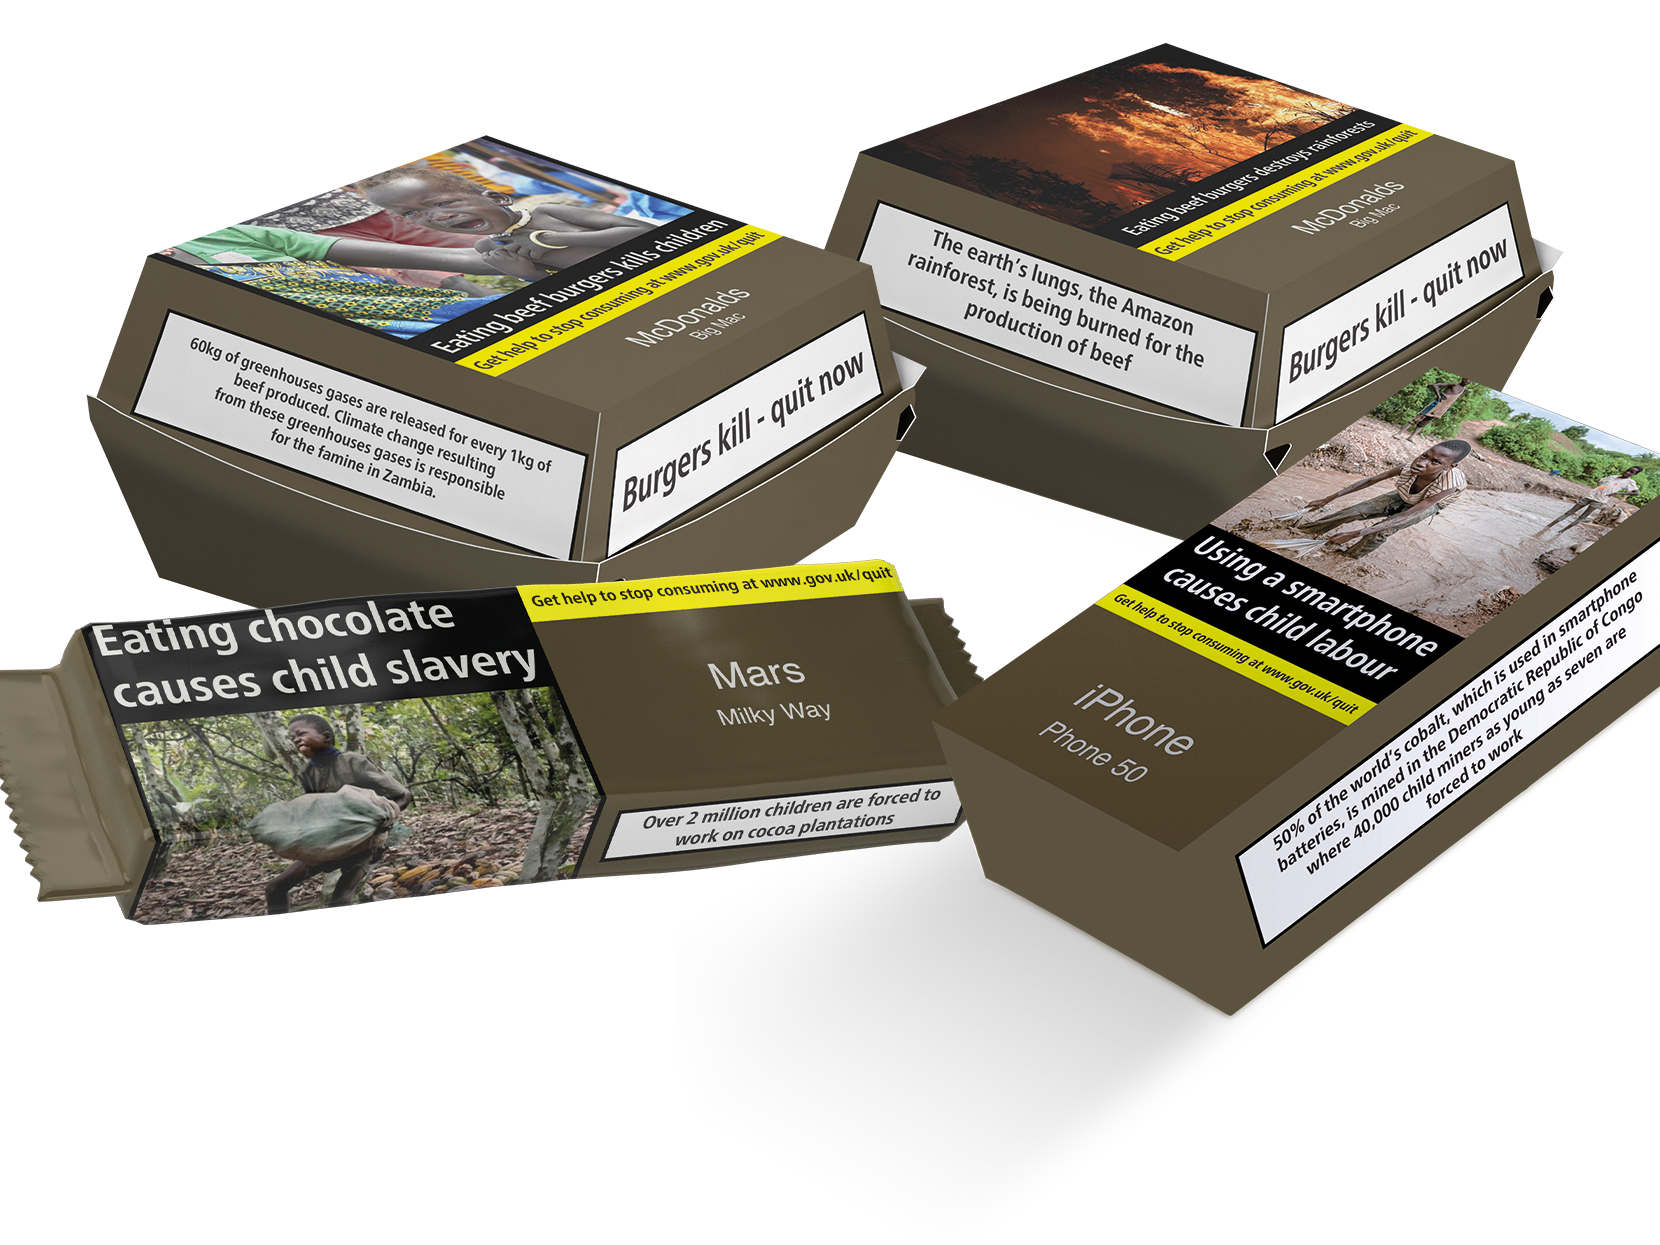
The issues I chose to use photographs for my infographics, to provide somewhat of a shock factor by combining the images of child labour with the chocolate bars familiar to the consumers who perpetuate the issue.
For those stats that were percentages, I used the foil on the chocolate bar to visually indicate these percentages and have the effect of ‘uncovering’ the abuses that are taking place behind the production of the chocolate bars.
For the first visuals, I used comparison between the children in Ghana and Cote D’Ivoire and school children in England - with photos that directly compare school children in the UK with those children working in cocoa production in Ghana and Cote D’Ivoire.
